
Jakarta: A City at the Thermal Breaking Point
Jakarta is often defined by its contradictions: a relentless economic engine and a chaotic yet vibrant home. As the heart of Indonesia, its identity is forged by the skyline of skyscrapers and the legendary exasperating pulse of its traffic. Within the borders of DKI Jakarta, over 10 million lives bustle in a complex, high-pressure urban dynamic (BPS, 2025).
These different facets can be found in the spaces between landmarks. The Sudirman corridor is a canyon of glass and black asphalt, filled with suited professionals navigating the modern workforce. This area functions as a literal thermal battery, absorbing solar energy all day and radiating it back into the streets. Just a few meters away lies the Kampung, where life spills into narrow, colorful alleys and the scent of street food mixes with the sound of children playing. In these dense neighborhoods, the heat isn’t just an inconvenience, it is an inescapable environment.

Down South, the canopy of trees in Jagakarsa represents the city’s remaining ecological defense; here, the air is noticeably cooler, a remnant of a greener past. In the center, Senayan becomes a thermal buffer, where open fields of Gelora Bung Karno allow the city to breathe. Reaching North, however, Tanjung Priok represents the thermal breaking point of the city, the vast stretches of asphalt and industrial activities create a micro-climate of high-intensity heat.
The Urban Heat Island Effect
The dramatic temperature differences in Jakarta are not accidental, but symptoms of a meteorological phenomenon: the Urban Heat Island (UHI) effect.
Imagine leaving a metal car in the sun all day, it gets scorching hot, far hotter than a shaded garden nearby. Jakarta does the same thing at city scale. Concrete, asphalt, and glass absorb the sun’s heat all day and release it slowly at night, making the city significantly warmer than the surrounding countryside. This is the Urban Heat Island effect.
At its core, UHI is a problem of energy balance, driven by several thermodynamic processes. The ‘heat trap’ of Jakarta’s environment is maintained by intersecting forces:
- Thermal surfaces: concrete and asphalt replace greenery, absorbing solar energy and radiating it back as heat.
- Urban geometry: towering skyscrapers and narrow streets trap heat and block wind ventilation.
- Anthropogenic heat paradox: air conditioners cool interiors but expel waste heat into the outdoors, raising ambient temperatures and forcing neighboring buildings to run their own AC harder, creating a self-reinforcing cycle.
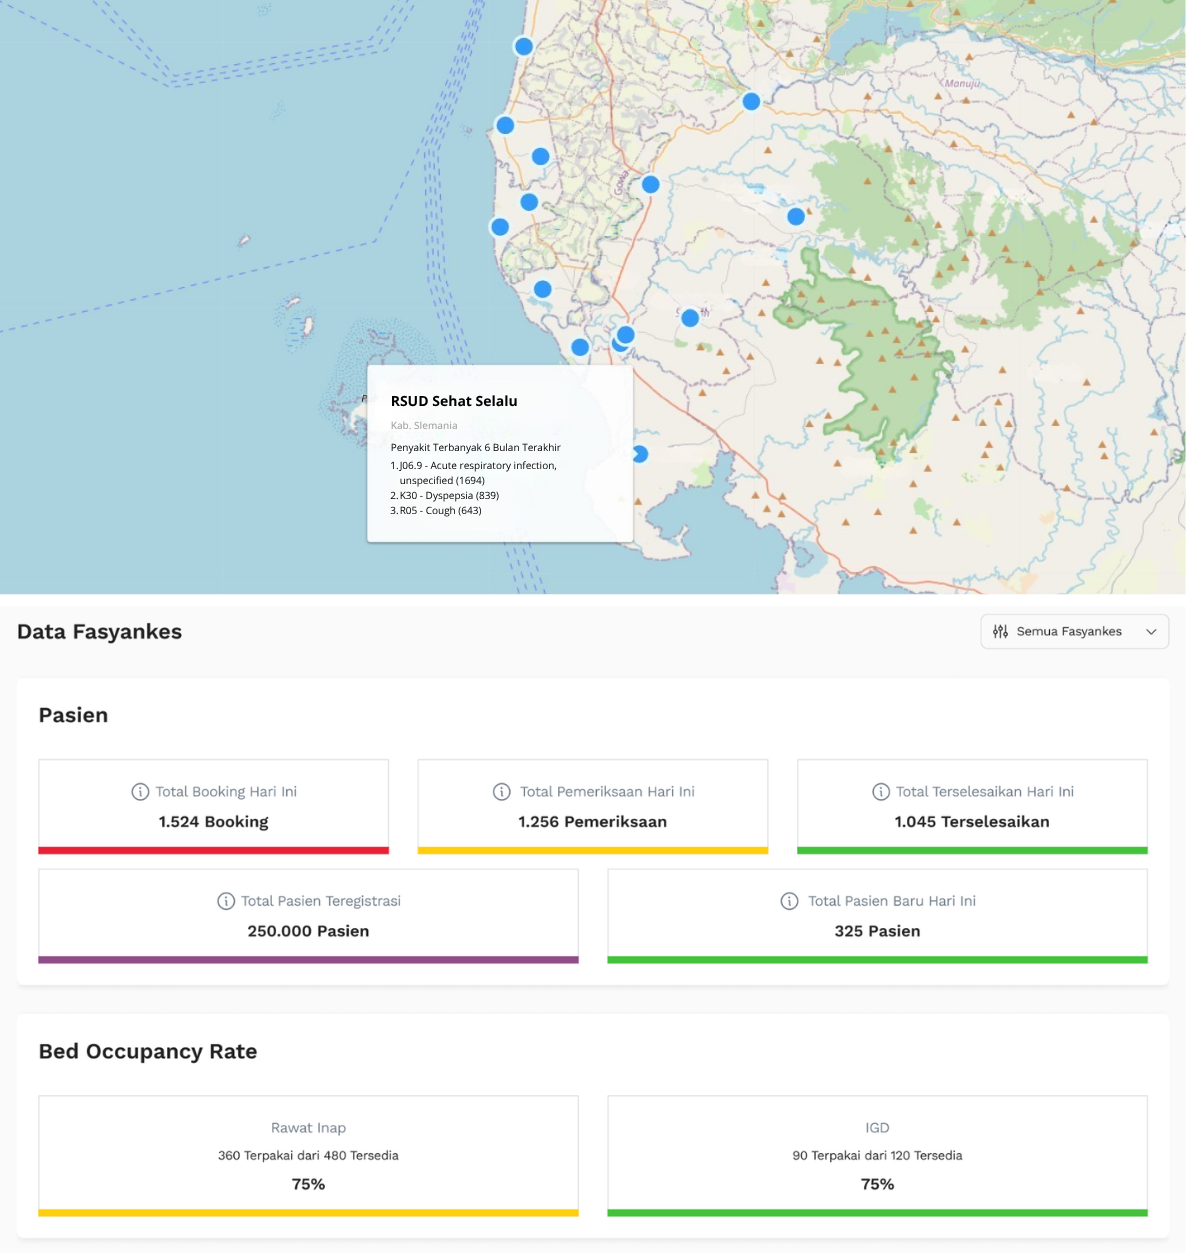
By analyzing 20 years of satellite data (MODIS and Landsat), researchers found that the Surface Urban Heat Island has not just intensified but expanded (Siswono, 2023). Meteorological stations recorded a 2.12°C rise in maximum daily temperatures over the last century. Satellite imagery reveals that Land Surface Temperatures (LST*) in Jakarta’s inner city are now 3°C to 6°C warmer than surrounding rural areas.
MODIS and Landsat are NASA satellites that photograph Earth’s surface from space. Scientists use their images to measure how hot the ground is — called Land Surface Temperature (LST). Think of it as a thermometer, but one that can read the temperature of an entire city from orbit.
The areas with extreme heat are no longer confined to the industrial north and city centre — they are creeping into residential suburbs and satellite cities like Depok, Tangerang, and Bekasi. Between 2004 and 2020, built-up areas in the metropolitan region increased by 25%, while vegetation decreased by nearly 20%. As the lungs of Jakarta are paved over, cooling green spaces are replaced by heat-absorbing concrete.
The Human Cost: Heat as a Health Crisis
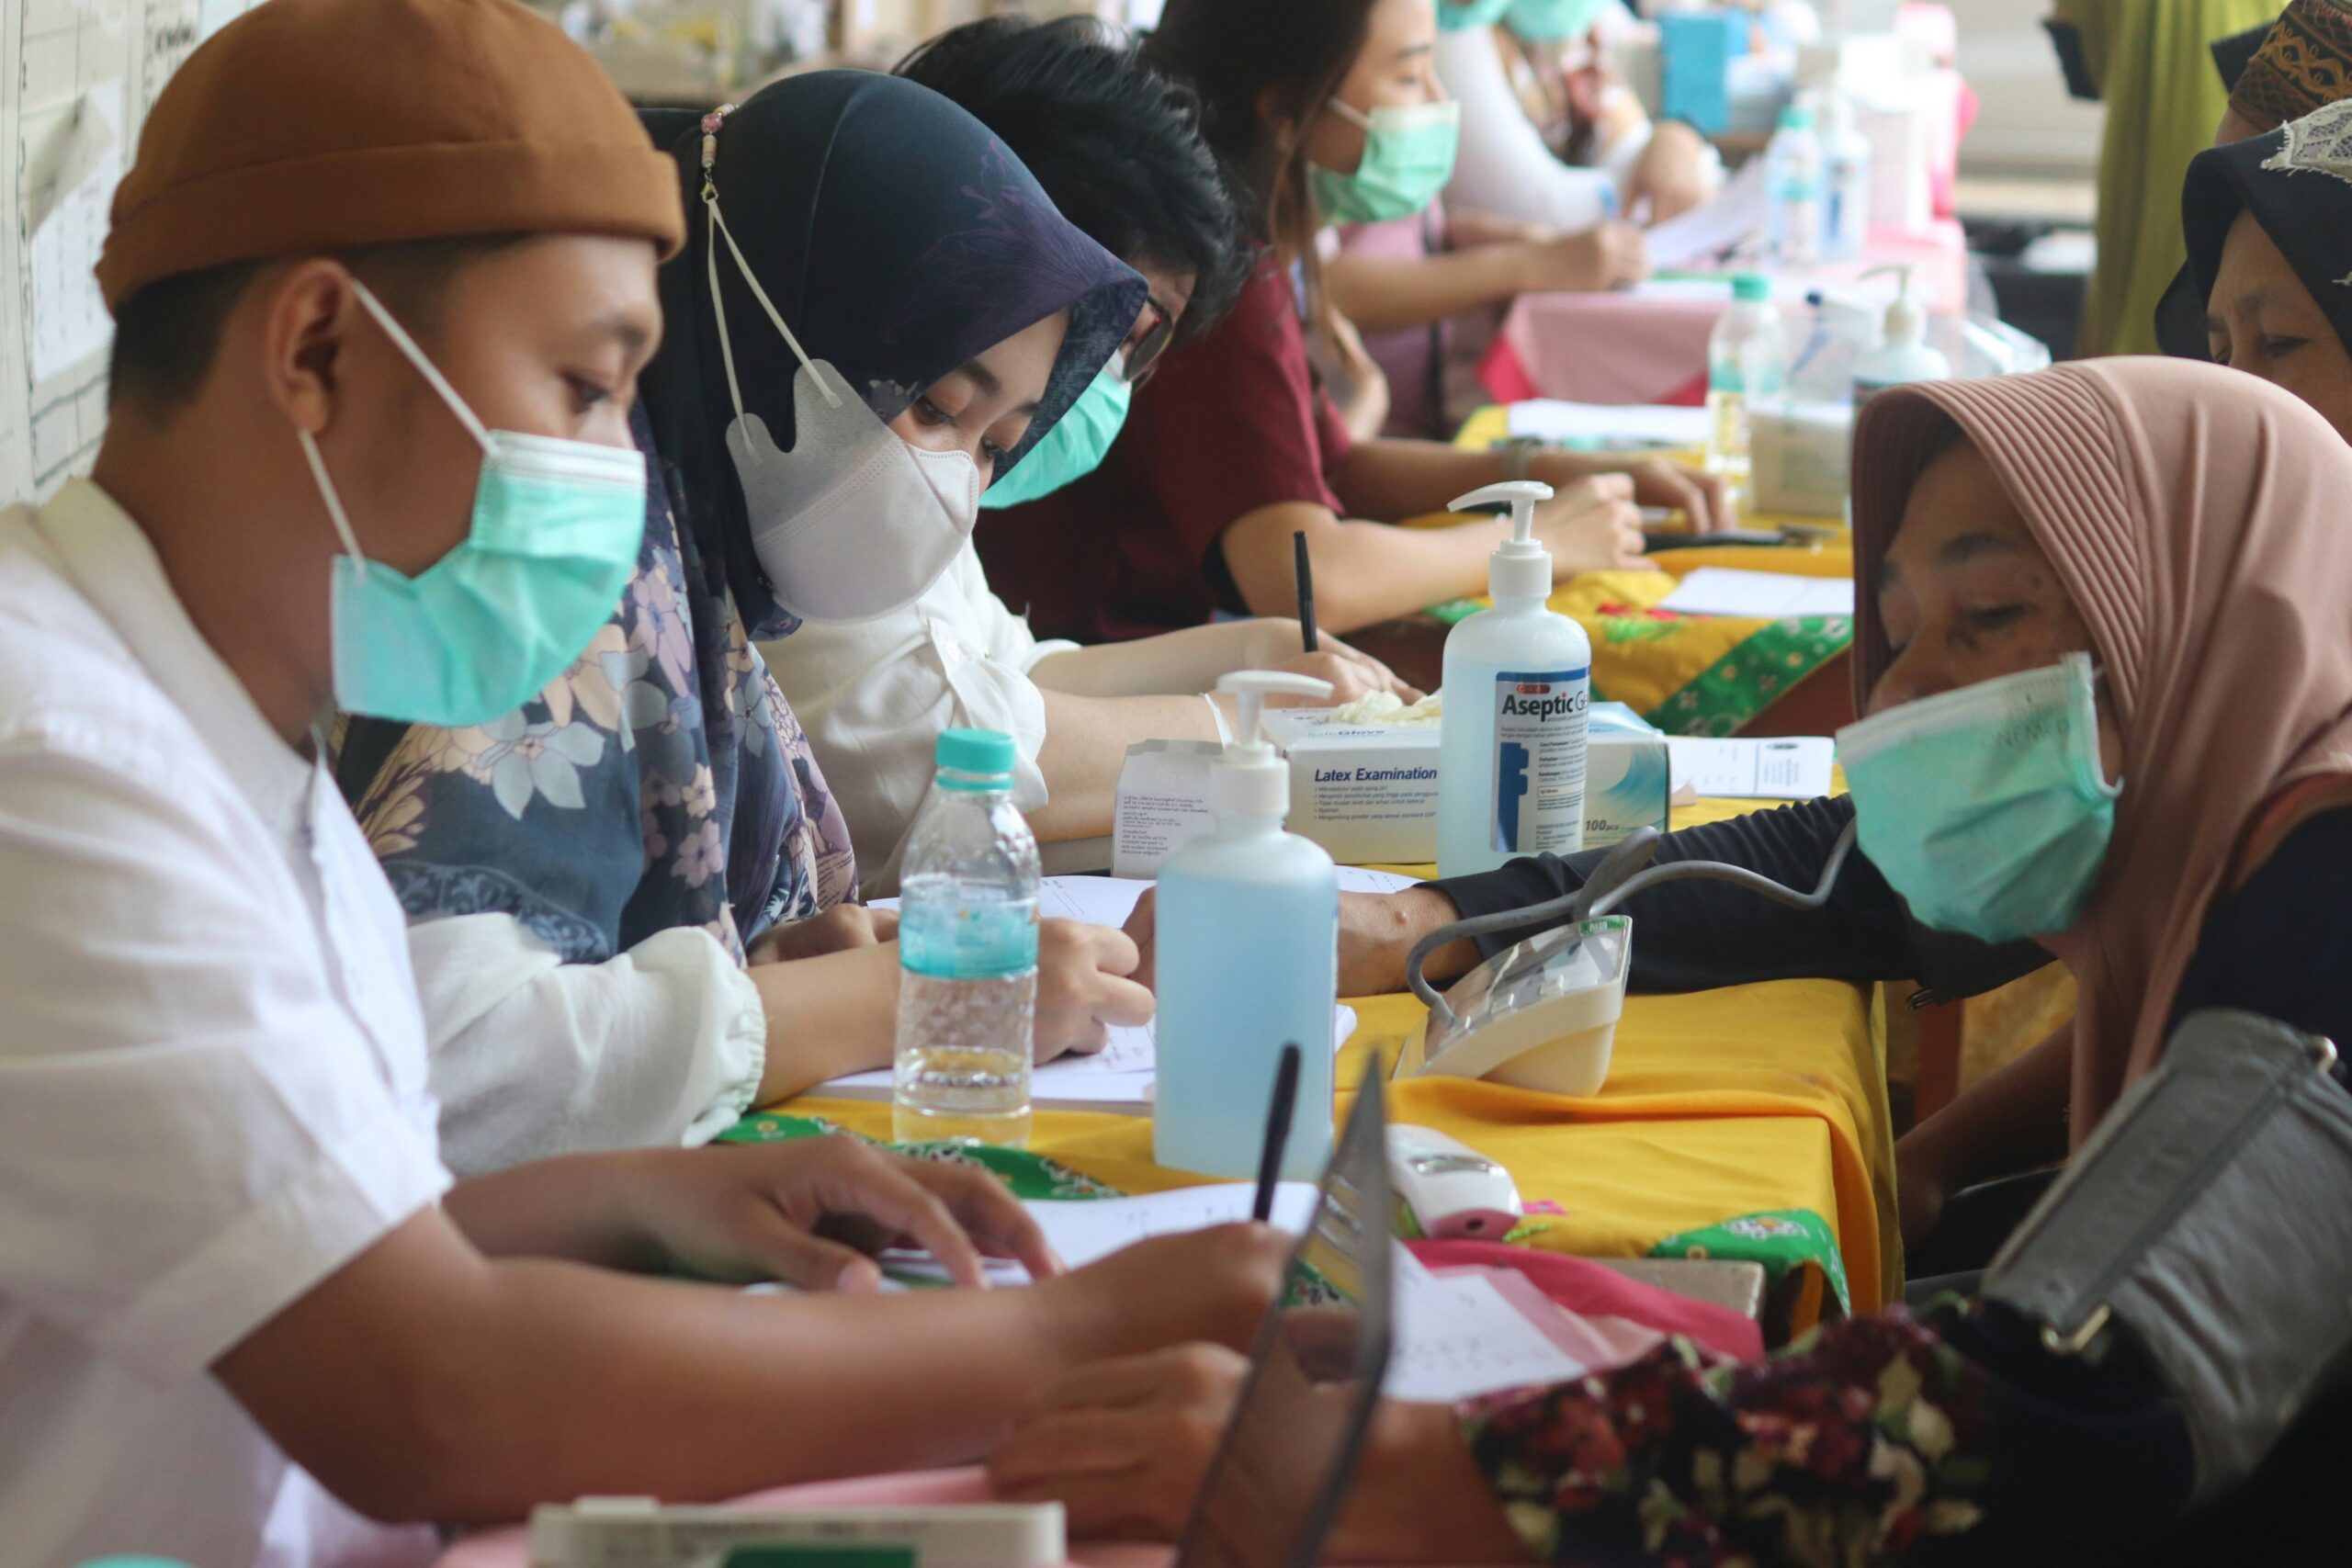
The rising heat of Jakarta takes a measurable toll on the human body. When the city’s temperature spikes, the burden on Indonesia’s national health insurance system (BPJS Kesehatan*) follows the same curve.
BPJS Kesehatan is Indonesia’s national health insurance program — similar to Medicare in the US or NHS in the UK. It covers hundreds of millions of Indonesians and handles billions of healthcare transactions annually, making its data one of the most complete pictures of public health in the country.
Key Climate-Health Statistics
| Heat-Health Metrics | Finding |
|---|---|
| On ‘hot days’ (above 90th percentile temperature) | Primary care visits increase by 8% [4] |
| 1°C rise in 7-day average temperature | 3% increase in diabetes-related healthcare visits [5] |
| 1°C rise in 14-day average temperature | 4% increase in diabetes-related healthcare visits [5] |
| High-emission climate scenario | Additional 2.8 million primary care visits/year |
| Financial burden (primary care alone) | ~US$25 million (Rp336.41 billion) per year |
| Crossing the Thermal Distress Threshold (WBGT* 29.8°C) | 21% increase in risk of acute psychiatric emergency admissions [6] |
Wet Bulb Globe Temperature (WBGT) is a measure of heat stress on the human body. Unlike a regular thermometer, it accounts for humidity, wind, and sun exposure — the factors that make heat dangerous. A WBGT of 29.8°C is roughly the point where the body struggles to cool itself, especially for the elderly, outdoor workers, and people in poorly ventilated homes.
These surges do not just cost money, they exhaust the healthcare workforce. In a country with an already low doctor-to-population ratio, administrative overload creates bottlenecks that lower quality of care for everyone, regardless of condition. The impact extends beyond the physical: heat acts as a driver of acute mental health crises. The city’s most vulnerable residents such as the elderly, outdoor laborers, and those in poorly ventilated homes of the Kampung, bear the heaviest burden.
Urban Intelligence: From Reactive to Predictive
Jakarta cannot solve a 21st-century climate crisis with 20th-century tools. To protect its residents, the city must shift toward Urban Intelligence: using data not just to describe the problem, but to predict and prevent the next crisis. Today, the city operates reactively responding to health emergencies only after hospital beds are full. Integrating AI and digital health can provide real-time visibility before situations escalate.
The foundation is already being built. The national SATUSEHAT digital health platform consolidates patient data from thousands of health facilities across Indonesia. But its potential must extend beyond health data alone: SATUSEHAT needs to integrate with meteorological data to enable Climate-Health Early Warning Systems (CHEWS) — translating temperature forecasts into actionable disease-risk insights for provincial health offices.
Three Actions Jakarta Must Take Now
1. Accelerating Climate-Responsive Design & Green Infrastructure
Jakarta’s heat crisis will not be solved by waiting for trees to grow. We need to redesign the city with precision. As mandated by law (Law No. 26 of 2007 on Spatial Planning), Jakarta’s Provincial Government has committed to converting 30% of its total area into green spaces (Ruang Terbuka Hijau) by 2045.

AI-based thermal mapping turns this commitment into action: by identifying specific hotspots at the neighborhood level, city planners can target the zones that need intervention most urgently, rather than spreading resources thin across the entire city. Beyond trees and parks, climate-responsive design must be built into Jakarta’s physical fabric, so the city’s infrastructure becomes part of the solution.
Responsible agencies:
- Dinas CKTRP (City Planning & Land Authority): revise zoning maps using AI thermal hotspot data
- Bappeda DKI Jakarta: embed RTH targets into the 2025–2045 RPJPD with annual milestones
- Kementerian PUPR: mandate cool-roof and permeable pavement standards in new building permits
Suggested timeline: AI thermal mapping deployment: 12–18 months. First RTH priority zones identified: 24 months.
2. Turning Heat-Health Data into Actionable Insights
Jakarta already has powerful digital tools. The ‘JAKI’ super-app delivers real-time flood and extreme weather warnings, directly integrated with the City’s Disaster Management Agency (BPBD). The next step is predictive, not reactive. By combining meteorological, epidemiological, and behavioral data, early warning systems can forecast heatwaves and heat-related disease outbreaks with greater than 90% accuracy, giving health authorities and communities critical lead time.
At the hospital level, AI algorithms can integrate clinical, environmental, and sociodemographic data to anticipate spikes in emergency department visits before beds run out. High-resolution spatial data can direct resources to the right neighborhoods.
Responsible agencies:
- Kementerian Kesehatan RI: mandate integration of BMKG meteorological data feeds into SATUSEHAT
- Dinas Kesehatan DKI: pilot a city-level health dashboard with BOR and heat-illness surge indicators
- BPBD DKI: expand JAKI’s early warning system to include heat-health risk alerts by neighborhood
3. Breaking Down Institutional Silos
Jakarta does not lack data. It lacks connection between data systems. Indonesian Agency for Meteorological, Climatological and holds meteorological records, The Ministry of Health holds patient data, SATUSEHAT is building the digital health infrastructure, none of these work at full potential in isolation.
Bridging these systems is not a technical upgrade, it is a government imperative. Digital health becomes the connective layer that transforms isolated datasets into a city-wide early warning and response system. Public-private partnerships bring in the technological expertise, investment capacity, and implementation speed that no single agency can provide alone. The goal is not more data, it is smarter connections between the data we already have.
Responsible agencies:
- Kantor Gubernur DKI: establish a cross-agency Climate-Health Task Force (BMKG + Dinkes + BPBD + Bappeda)
- BPJS Kesehatan + Kemenkes: define data-sharing protocols for anonymized patient data to feed early warning systems
- Bappenas: include climate-health integration as a formal workstream in the National Digital Health Roadmap
National roadmaps have laid a clear path. But roadmaps do not move cities, people do. Jakarta already has the data to prove the crisis and the tools to predict its next move. What remains is leadership willing to act on both.
The tools are within reach, the evidence is in. What remains is a choice: let Jakarta grow hotter in silence, or act, together, before the next heatwave makes the decision for us.
References
[1] BPS-Statistics Indonesia DKI Jakarta Province. (September 15, 2025). Population, Population Growth Rate, Percentage Distribution of Population, Population Density, and Population Sex Ratio by Province/Regency/Municipality, 2025.
[2] Urban Heat Islands — UCAR Center for Science Education. Accessed March 13, 2026.
[3] Siswanto et al. (2023). Spatio-temporal characteristics of urban heat island of Jakarta metropolitan. Remote Sensing Applications: Society and Environment, 32, 101062.
[4] Fritz, M. (2022). Temperature and non-communicable diseases: Evidence from Indonesia’s primary health care system. Health Economics, 31(11), 2445–2464.
[5] Andriani, H. et al. (2025). Time Series Analysis of the Impact of Ambient Temperature on Healthcare Service Utilization by Diabetes Patients in Jakarta. Global Transitions, 8.
[6] Jayadi, T.I. et al. (2025). Quantifying the Boiling Point: A Distributed Lag Non-Linear Analysis of Heatwave Intensity and the ‘Thermal Distress’ Threshold for Psychiatric Morbidity in an Indonesian Metropolis. Scientia Psychiatrica, 6(3), 178–189.